Tuesday, April 22, 2014

Barometer Lab


We created a device similar to the one portrayed above in class.  This is a homemade barometer.  This device measures atmospheric pressure.  As the pressure changes, the straw will go up or down.  Below are the results of the experiment.


Mitochondrial Eve and Mitochondrial DNA

The purpose of this lab is to explain who Mitochondrial Eve is and show examples of different people across the world who have a different physical appearance.  Though people have many different physical features, they come from one single person, Mitochondrial Eve.  Mitochondrial Eve is the human we trace all of our DNA to.  DNA is traced back through the female gender.  This Mitochondrial DNA is copied nearly perfectly from the female.  This means that we can successfully trace or DNA all of the way back to the Mitochondrial Eve.


Russian:

Anna Kournikova


Morocco:

Hind Sahli


Japan:

Aya Suzuki


Nigeria:

Oluchi Onweagba


Puerto Rico:

Roselyn Sanchez Rodriguez


Map Lab

Choropleth map- A map where areas of the map are shaded to show the thing that is being measured.  The different shades make it easier for the viewer to distinguish the particular area they are looking at.  The map below shows the percentage of individuals living in poverty.


Dot Density Map-  A map where population is shown through dots.  The more dots are in an area, the more densely populated the area is.  The areas with little to no dots have a low population.  The map below shows the amount of farms in America.


Proportional Symbol Map-  A map that uses a certain symbol that varies in size to show whatever the map is measuring.  The larger the size of the symbol, the greater number of the thing being measured.  The map below shows the number of murders in the United States.


Isopleth Map-  A map that gives depth to a certain location.  It gives a three dimensional look.  The maps in many cases are used to show the concentration of things.  The map below shows Hydrogen ion concentration across the United States.


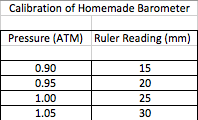
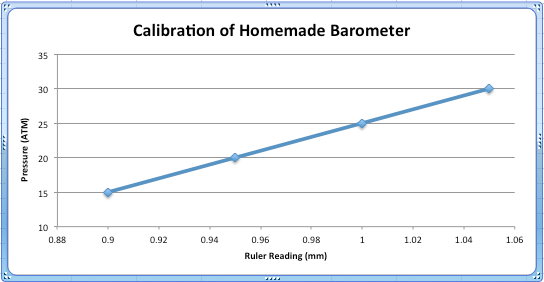
Tree Identification Lab
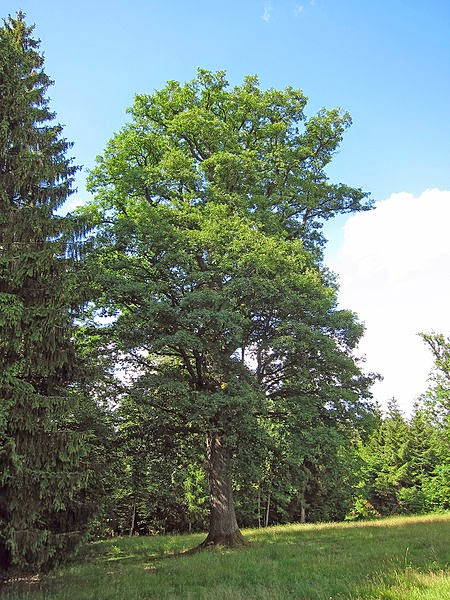
Oak Tree
Quercus

The Oak Tree is native to the Northern Hemisphere.  North America has the most Oak Trees with China being second.  There is one Oak in Louisiana that is estimated to be over 1,500 years old.


Broom Shrub
Cytisus scoparius


The Broom Shrub is most common in Europe, Asia, and Africa.  Specifically common in the Mediterranean region.  The shrub is typically between one and three meters tall.  Most species contain yellow flowers.
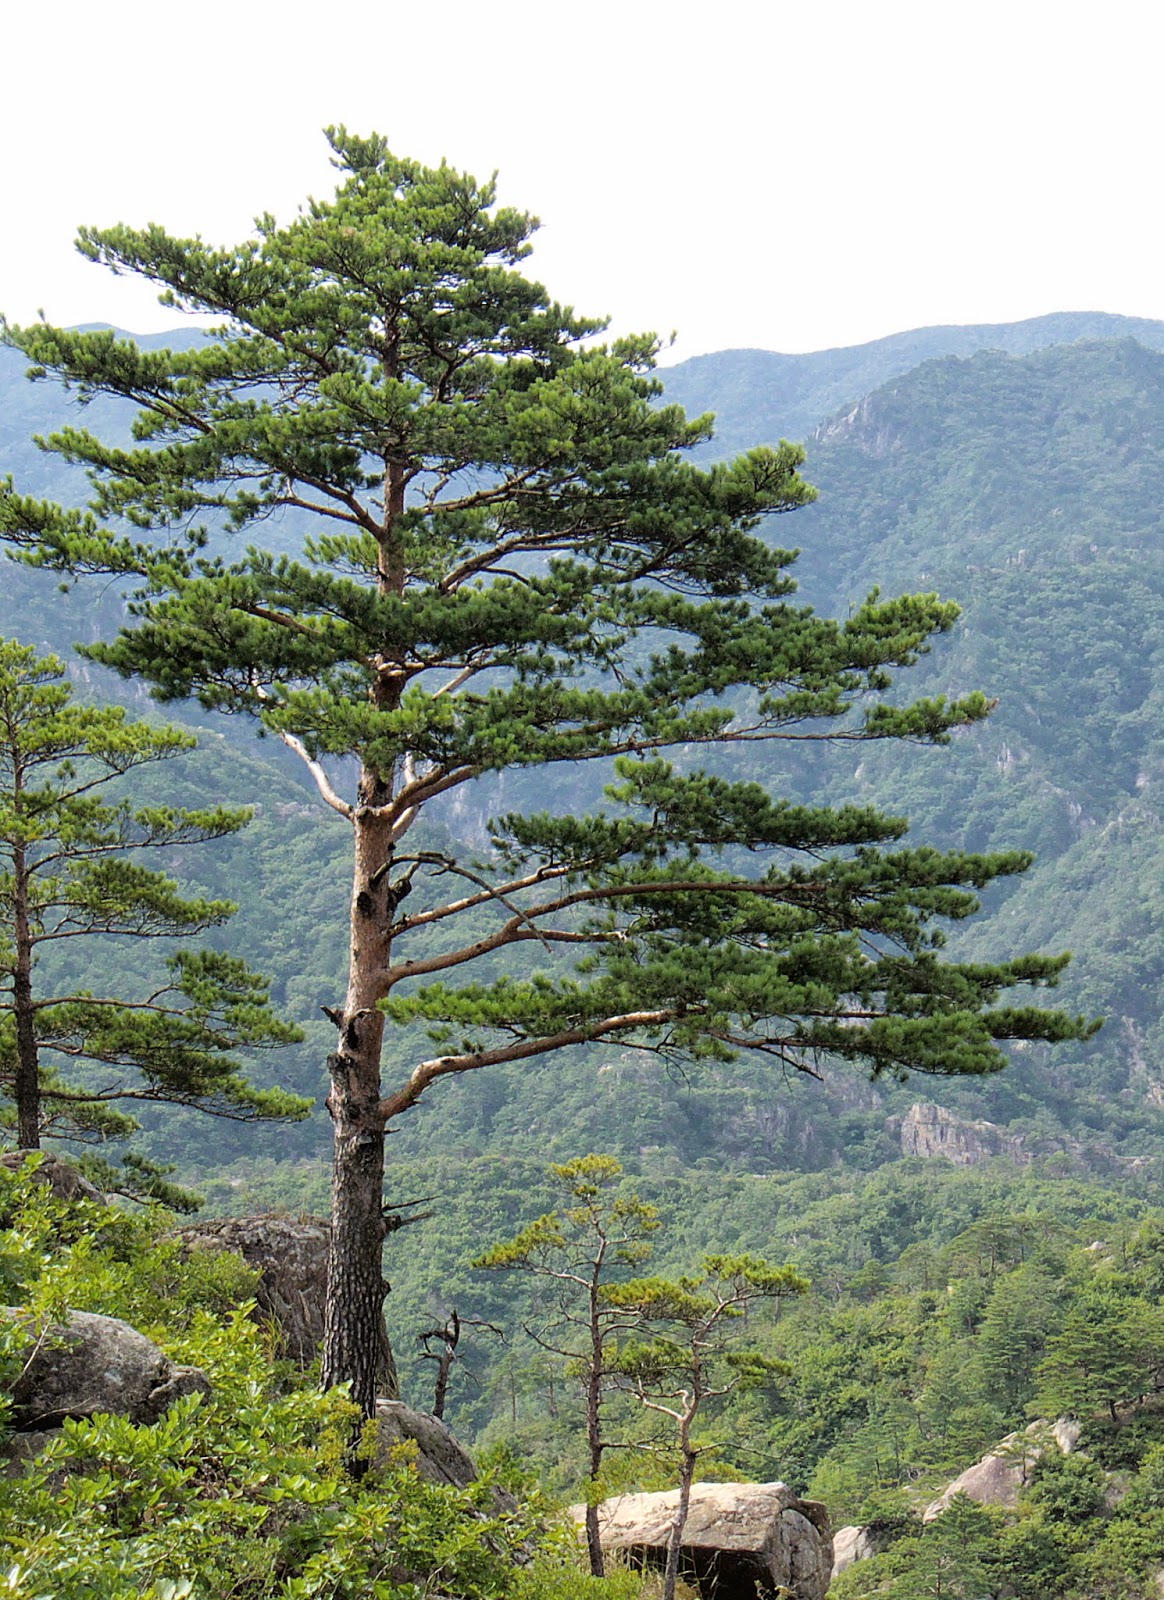
Pine Tree
Pinus


The pine tree is native to mainly the northern Hemisphere.  It is most common in the Southeastern United States.  There between 105 and 125 different species of pine.  Many are harvested for Christmas trees.


Barberry Shrub
Berberis vulgaris


The Barberry shrub is native to southern Europe, northwest Africa, and western Asia.  Most of these shrubs grow to around four meters high.  The Barberry tends to have small oval leaves.  It is a deciduous shrub.

Sycamore Tree
Platanus occidentalis


The Sycamore tree is native to North America.  The tree can grow up to thirty or forty meters in height.  The largest Sycamore tree recorded grew to fifty-one meters tall.

Thursday, March 27, 2014

Rock Identification Lab

The three different types of rocks we have on earth are metamorphic rocks, igneous rocks, and sedimentary rocks.  Metamorphic rocks are rocks that were once a different type of rock but due to heat, time, and pressure transformed into another type.  Igneous rocks are formed through the cooling of magma or lava.  Sedimentary rocks are fragments of other rocks transported to water.  The following are examples of each of these types of rocks.


This is an example of marble.  Marble is a metamorphic rock formed from limestone.


This is a piece of obsidian rock.  Obsidian is an igneous rock formed from the quick cooling of molten rock.


This is a sample of a breccia rock.  Breccia is a sedimentary rock made up of angular pebbles cemented together.

The following is an example of a soil texture diagram.  This triangle is used to classify the types of soil.  There are twelve types of soils that soil can be classified as.  
All can be found on this link (Twelve Types of Soils).

Soil Texture Diagram


Thursday, March 6, 2014

Sun Trajectory Lab

The goal of this lab was to determine the sun's trajectory based on an object fixed in the ground, the length of the object, and the cardinal direction the shadow pointed.  On January 27, 2014 Natalie Franklin performed an experiment in which she placed a pencil in the ground and measured the shadow the pencil cast.  She also measured the height of the pencil and determined the direction the shadow was pointing.  At the bottom I made a table filled with her data and also a screenshot of the sun's actual path using SunCalc.net. 


Tuesday, January 21, 2014